

When Numbers Lie

What happens when we lose trust in data?
The United States has invested billions in building a data infrastructure designed for businesses and individuals to make necessary economic decisions. The promise is simple: more data equals better decision-making.
But that infrastructure, and the quality of data it produces, is under attack.
The Data Trust Crisis
We live in a world drowning in data, but not all of it is trustworthy. Data literacy has never been more essential. Every unemployment rate you read, every chart showing inflation trends, every "X% increase" headline printed is shaped by hidden forces. One of the most important is measurement error.
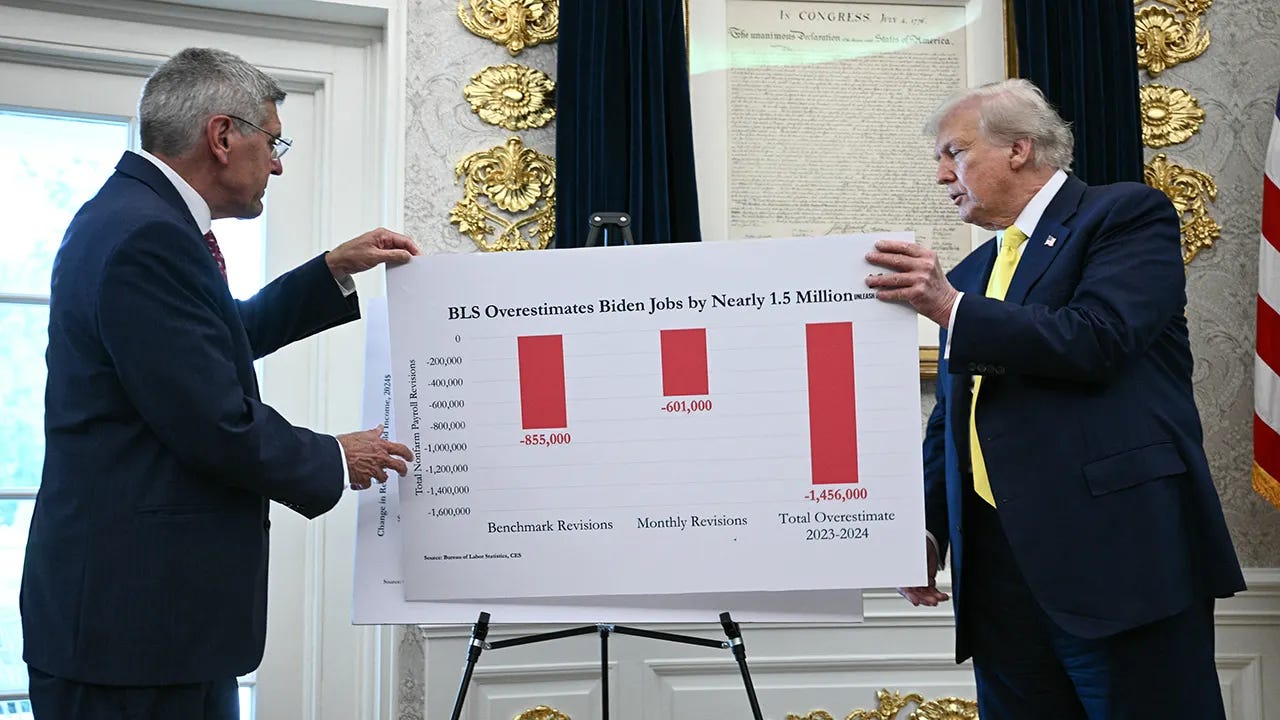
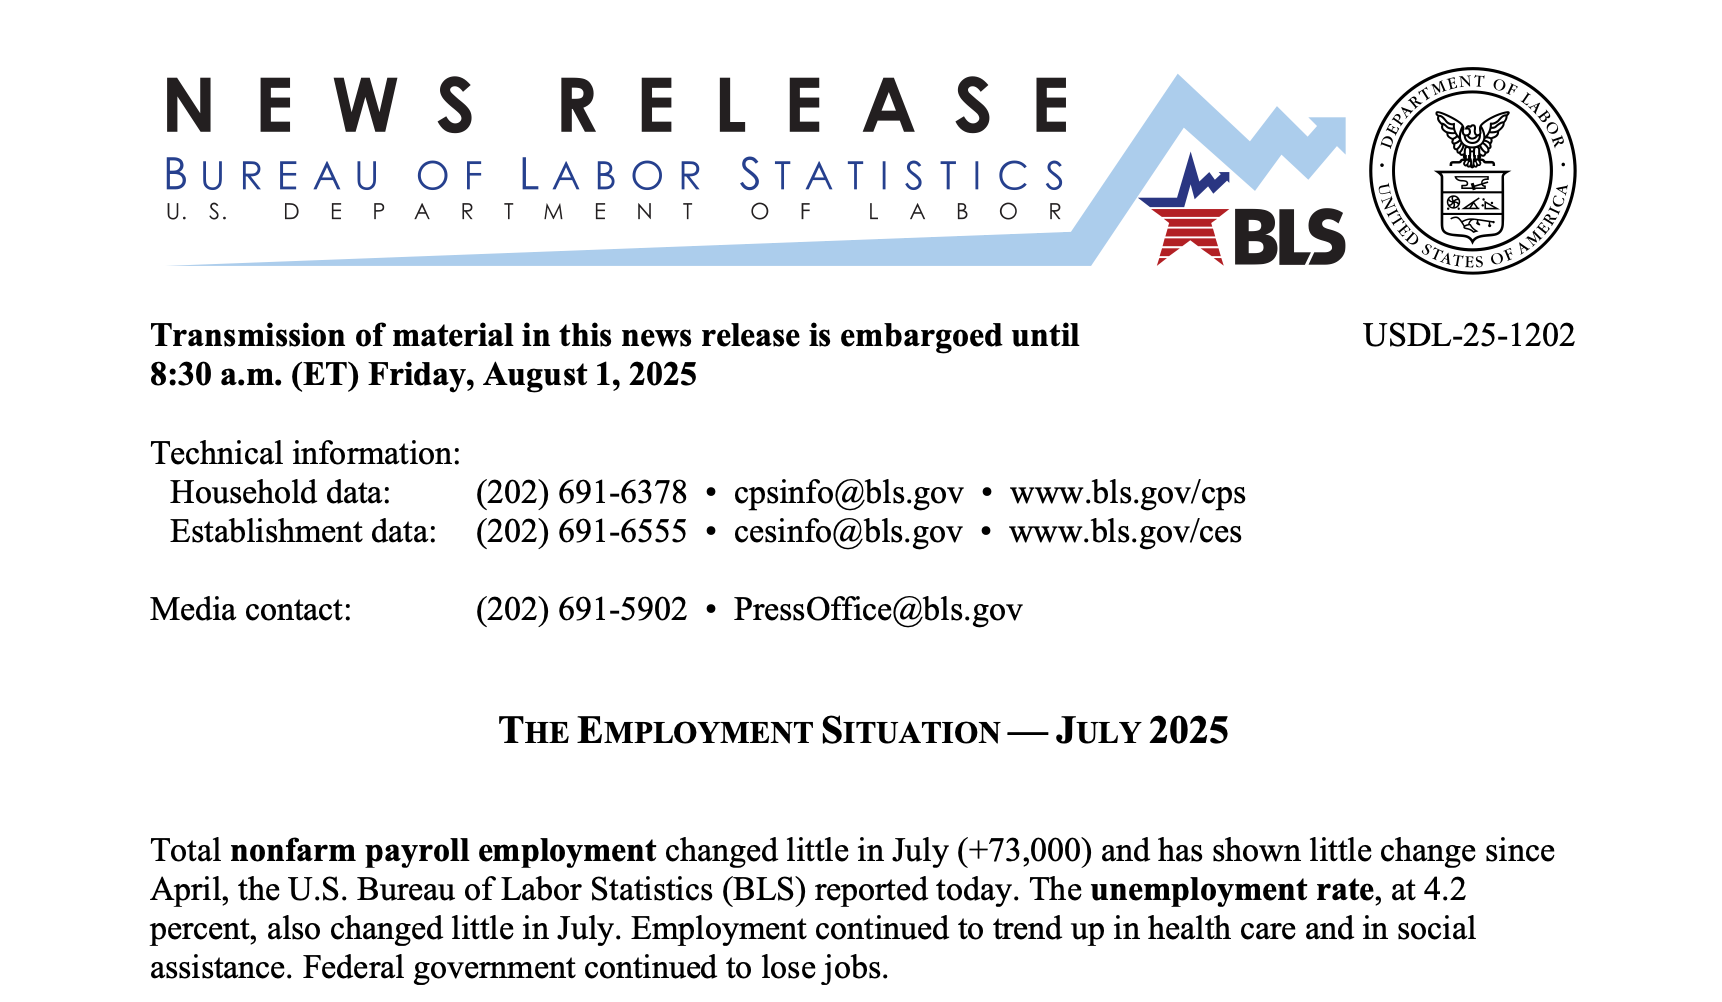
Measurement error came front and center this past month with the latest employment report from the Bureau of Labor Statistics. The revisions, which are a regular part of the process, raised concerns about bias in data reporting.
Here at Decode Econ, quality data and public trust go hand in hand. A quick scan across the world reveals that access to reliable public data is a privilege that most countries lack. The erosion of trust will negatively impact data access, quality, and our collective ability to make informed decisions.
Restoring trust in data should be everyone's priority.
What Is Measurement Error?
Measurement error is the difference between the actual value of something and the estimated value based on the data we have.
In the case of jobs created, it is the difference between the value we estimate, based on our data, and the actual number of jobs created in the economy. Since it is expensive to collect all the data, we rely on a sample to estimate it.
That difference can be small and ignorable, or large enough to change policy, shift billions in funding, and shake public trust.
In an age when trillion-dollar decisions flow from data, understanding measurement error isn't just for economists or statisticians; it's for anyone who wants to make sense of the world.
The Two Types of Error
Systematic Error (Bias): Consistent, directional mistakes. Think of a bathroom scale that's always two pounds heavy. Every reading is wrong in the same predictable way.
Random Error: Unpredictable variation. Measure your desk three times with the same ruler, and you'll get slightly different numbers each time.
Here's a simple way to think about it: Imagine wearing blurry glasses. If the blur always tilts left, that's a systematic error. If it shakes randomly, that's a random error.
Both cause problems when making data-driven decisions. Random error? Increase your sample size for better precision. Systematic error is much harder to diagnose and fix.
When Small Errors Create Big Problems
Minor measurement errors can trigger massive policy mistakes:
Census Undercounts: Missing rural, low-income, or minority households means billions in federal funding never reach the communities that need it most.
Unemployment Data: A wage change from $15.15 to $15.25 might look like a cause for celebration, until you realize it's within the margin of error and statistically meaningless.
Medical Research Bias. For decades, drug trials excluded women. Result? Medical guidelines are built on incomplete evidence, leading to misdiagnoses and ineffective treatments for half the population.
How to Fight Back Against Bad Data
Increase Funding for Data Collection- The Law of Large Numbers is clear: larger samples give us estimates closer to the actual value. More data means more confidence in our results.
Rebuild Survey Response Culture- As citizens lose trust in federal surveys, response rates plummet. This becomes catastrophic when specific groups systematically refuse to participate, skewing results.
Address Selection Bias Head-On – Selection bias happens when the people or organizations in your dataset aren’t representative of the whole population. The recent Bureau of Labor Statistics revisions to the monthly jobs report offer a perfect example. To report the number of jobs created, the BLS relies heavily on the establishment survey, which collects employment data from businesses. Healthy companies, with stable operations and staffing, tend to respond quickly. Companies going through more challenging times, such as experiencing layoffs, hiring freezes, or financial stress, will often respond later or not at all.
This timing creates a hidden bias: early responses overrepresent healthier firms, making the initial jobs numbers look stronger than the whole picture. When later responses from struggling companies are added, revisions often trend downward. This isn’t evidence of manipulation—it’s the process of replacing a skewed early snapshot with a fuller, more accurate picture.
Fixing this requires:
Adjusting methodologies to account for predictable response patterns.
Improving early response rates from struggling firms.
Communicating clearly that revisions are part of improving accuracy, not undermining trust.
Protect Democratic Data Access- Without proper funding, we'll increasingly depend on private data sources. As Janet Harrah, Executive Director of the Center for Economic Analysis and Development at Northern Kentucky University, notes:
"Federal data sources have democratized access to data and allowed everyone to know what's happening in the economy."
Without public data, only well-funded organizations will have access to quality information, and that is a threat to democratic decision-making.
The Bottom Line
Data quality is the foundation of evidence-based decisions. But data quality ≠ data quantity. We don't just need more data, we need better data.
Measurement error reminds us that numbers aren't perfect mirrors of reality. They're estimates, influenced by our tools, methods, and sometimes our biases.
That's not a reason to distrust data entirely. It's a reason to handle it with the care it deserves.
When we understand and account for measurement error, we can design better policies, make smarter decisions, and build the kind of trust that turns raw numbers into actionable knowledge.
What questions do you have about data quality? Hit reply—I'd love to hear your thoughts.
About Decode Econ
Decode Econ makes the economy make sense—one post at a time. We break down complex economic news and data into clear, actionable insights that connect directly to your life. Decode Econ is your guide to understanding how numbers, policies, and trends shape the world around you.
Subscribe to get every post delivered straight to your inbox.
Help us grow—forward this email to 3 friends or colleagues who care about making sense of the economy. Or share this post so they can join and help us grow!
What I notice with textbooks is that to the extent that they discuss surveys and data collection, they only describe how the process would work in an ideal situation -- never potential problems. But problems are rife even in the best of times, and data has always been subject to misuse -- I can mention in this context Mark Twain's famous comment about "Lies, damned lies, and statistics". Students are skeptical in 2025 -- and that can be turned into a good thing if we teach healthy Critical Thinking, making use of reliable sources, considering normal data variation, looking at credible assessments of the possibility of data errors, etc. In the specific current case of error correction in unemployment and inflation data, it is perfectly obvious to every reputable economist that the sheer level of uncertainty in business in the first quarter of 2025 due to tariffs, DOGE cuts and ICE raids is extraordinarily high, and businesses have been reducing investment and managing prices to cope -- the likelihood that revisions would be much worse than initial estimates was easily predictable due to the factor that you mention -- businesses that are having a harder time report their data later than those that are doing well. There was never any reason to question the validity of this data. The danger to data quality over time is high, inasmuch as experienced officials in government data-collection offices have been retiring and taking layoff paychecks at a high rate -- as is true of every government body overseeing the US economy.