

Inflation is Eating Up Your Time and Your Savings
Latest report by the BEA.


The Number Everyone Ignored Inside the Inflation Report
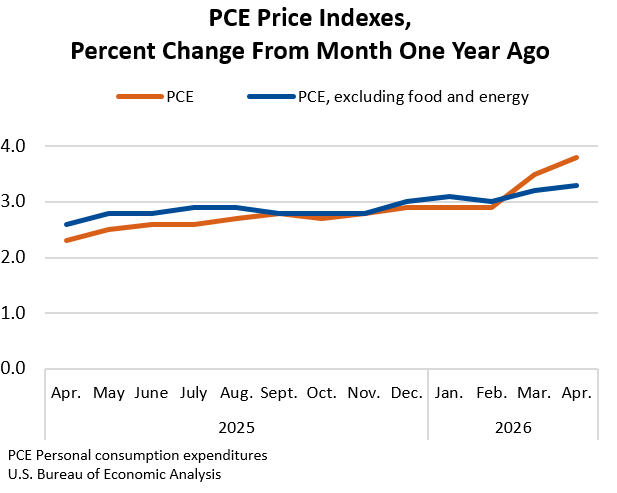
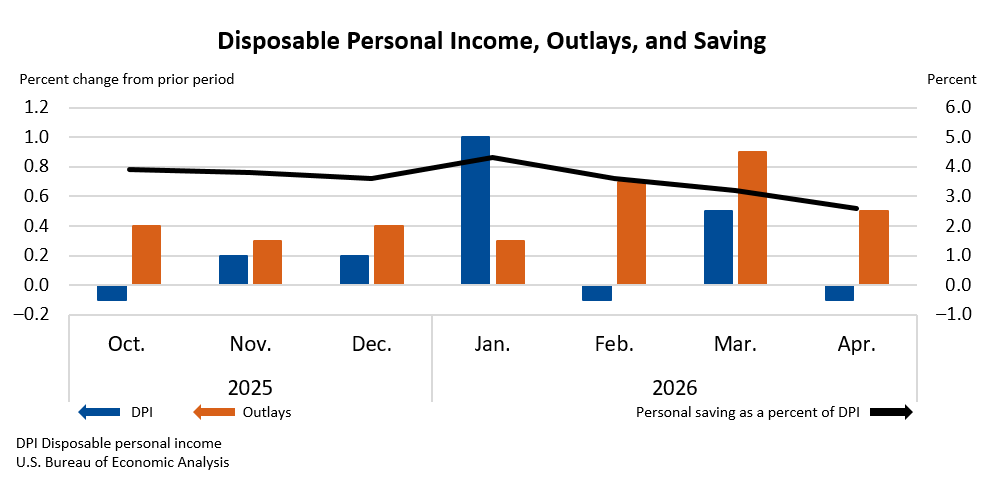
The Fed’s preferred inflation gauge, the PCE price index, rose 3.8% year-over-year in April, the highest reading since May 2023. That number got all the headlines. But buried two paragraphs down in the same BEA report was something more telling: the personal saving rate fell to 2.6% in April, down from 3.2% in March and 4.3% in January. That’s the number that should be worrying you and me. Higher prices are coming for our savings.
THE ECONOMICS
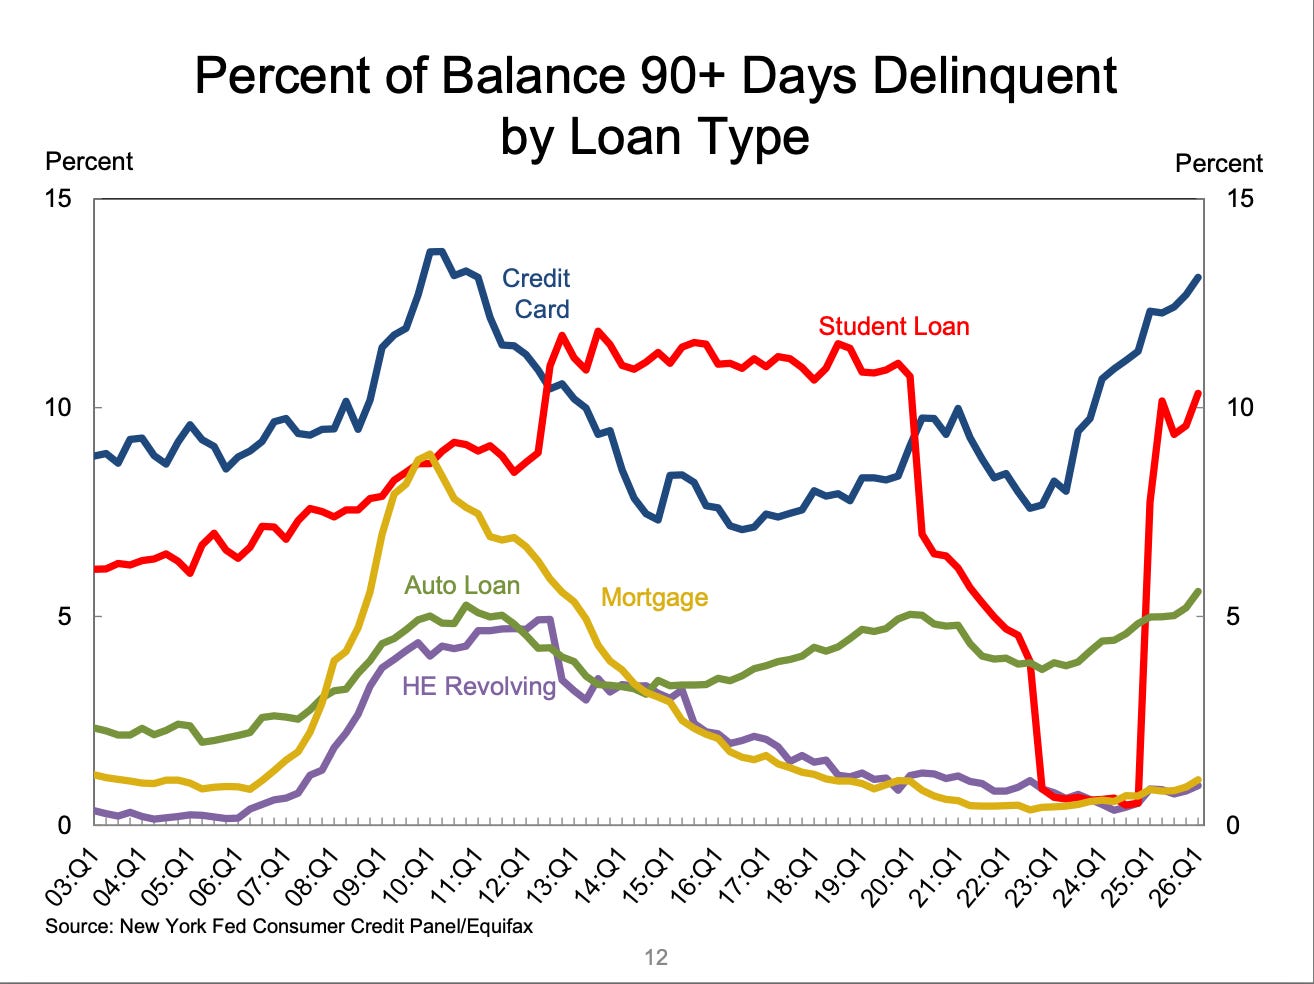
This is a real income squeeze running headfirst into consumption smoothing. American households have one of two choices, buy less or save less. If you are trying to maintain spending even when real incomes fall, it will cause you to draw down savings or take on debt to bridge the gap. Credit card debt reached $1.25 Trillion, fueled by higher prices and higher interest rates as inflation continues to rise. The Federal Reserve Bank of New York reported that percent of credit cards with balances that are 90 days past due increased to 13.1% up from 12.3% a year earlier.
Real disposable income fell 0.5% in April, the second consecutive monthly decline. People aren’t spending more because they feel good. They’re spending more because gas, groceries, and rent are increasing and to make up, they are having to save less.
Over the past year, the personal savings rate went from 5.5% in April 2025 to 2.6% in April 2026.

“Dads are Choosing Family”

The chart above tracks labor-force participation for parents aged 25–44 with children under five. Mothers’ line runs upward for 35 years. Since 1990, it has increased from roughly 57% to near 70% today. Fathers’ line is nearly flat the whole time, hovering just under 97%, until COVID, when it fell.
The WSJ article highlights that between 2019 and the period ending in 2024, college-educated fathers boosted time spent on housework and childcare by more than four hours per week while cutting paid work by six hours. That is the first shift in two decades. And researchers are careful about the framing: the labor-force participation rate for fathers held near 94% in 2025, and unemployment for dads with kids under six sat at just 2.8%. These men are choosing to work, but they are working less in favor of more time at home.
While the WSJ is highlighting this as a big shift in the behavior of men, I am not convinced it is as drastic of a change as presented.
Across all couples with young children, women still do 14.8 more hours of unpaid weekly work than men. But that gap narrowed by 3.8 hours between 2019 and 2024 — and among the college-educated, it narrowed by 4.5 hours. It is good to see the allocation of household responsibilities adjust. But it is also a reminder of how much ground there still is to cover.

DR. A’S TAKE
Here’s what I think these two stories are actually telling us together: the savings rate story and the dad story are the same story.
When real incomes fall, every household has to figure out where the slack gets absorbed. Some families absorb it financially, drawing down savings to keep spending stable, which is exactly what the PCE data shows. Other families absorb it through labor reallocation, one partner scaling back paid work to cut what they’d otherwise spend on childcare. That’s part of what the dads data is picking up.
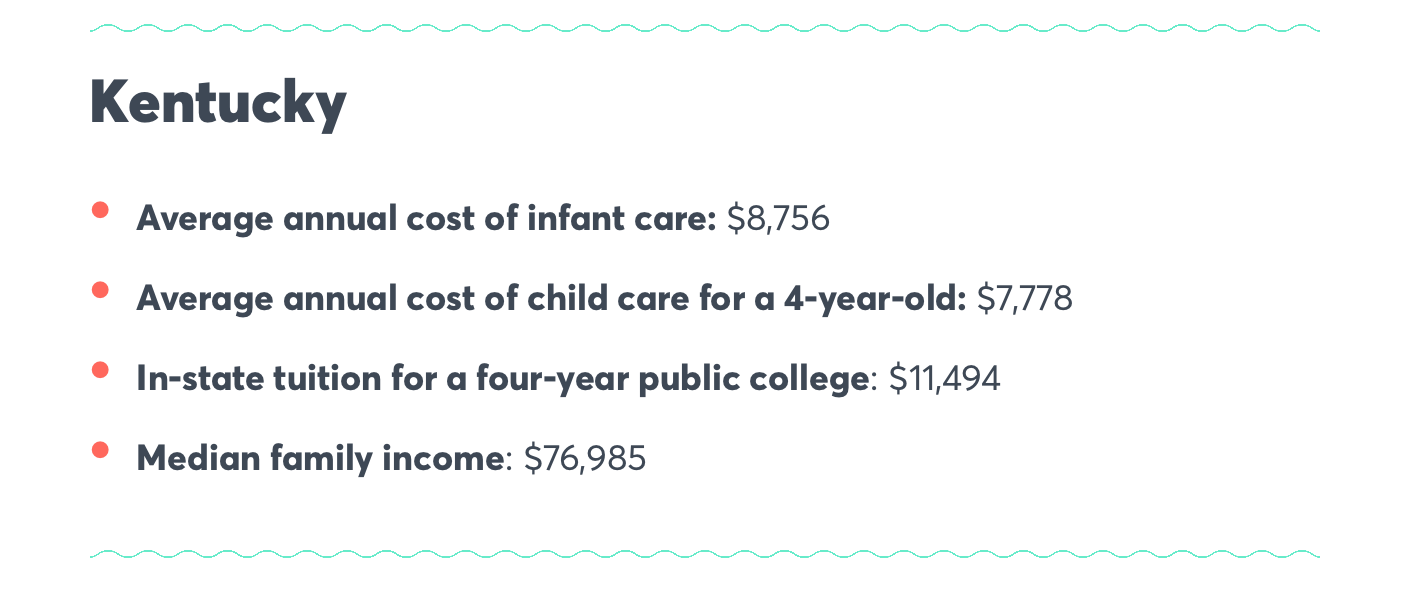
The framing of “dads choosing family” is genuinely true and worth acknowledging. It’s also incomplete. Some of this shift is cultural and deliberate. But some of it is a rational response to childcare costs that have gotten so high, and inflation that has squeezed budgets so hard, that the math on two full-time incomes no longer always works the way it used to. According to this CNBC data, the average annual cost of infant care is $8,756 in Kentucky.
I know families personally who have made the call to have one parent leave the workforce entirely, not because they wanted to, but because the numbers don’t work. Childcare costs that exceed a monthly mortgage payment have a way of making the "both parents work" assumption feel less like a choice. That pressure doesn't stop at the household budget. It shapes where families live, which jobs they take, and. as we've covered here before, whether they have more children at all.
In addition to childcare costs, add to that an increase in transportation costs with increased expectations to return to the office, and work becomes a financial burden. This was part of our discussion on the impact of higher prices on labor markets with economics_BS
WHAT IT MEANS FOR YOU
If your budget feels tighter than the headlines suggest it should, you’re not misreading the data. Roughly 65% of consumers say price increases now exceed their income growth.
THE MONEY MOVE
Check your savings rate, and your savings balance. Your cashflow might be tighter than usual, but If you’ve been dipping into it monthly to cover normal expenses, it’s a signal to revisit your budget.
And if you’re a household weighing whether one partner should scale back paid work, run the actual numbers on childcare and commuting costs before assuming two full incomes automatically wins. In more cases than people expect right now, the math is closer than it looks.
Monday’s Podcast
We appreciate the feedback on the discussion with Dr. Cecilia Cuellar If you haven’t had a chance to catch our podcast, you can find us on your favorite platform. Here is the YouTube link.
The data leans too heavily on Recency Bias for "men being home more"...
https://www.federalreserve.gov/econres/notes/feds-notes/what-drives-the-rise-in-remote-work-preliminary-evidence-from-utilization-rates-and-wage-trends-20250603.html
Using Covid Era data, when we know the rise in remote/hybrid work offset how time was spent at home. The days utilization, 2.3/weeek, doubled from 2020 to 2024. The share of time spent on "house things/childcare" increased. Let's see how back-to-office policies the last 18 months affect the data?
*I wrote a few other sentences before deleting... Having grown up with a father who was there for everything exposes my privilege and isn't good data science.
How individual households ovecome Expectations Bias rooted in gender roles is a very worthy discussion...
I've noticed an uptick in the number of TikTok videos about budgeting meals and making micropayments on debt. Of course, that could just be my algorithm at work, but it could be a canary in the coal mine.