

The Employment Report Is Sending Signals
And I want your read on it

Yesterday’s Employment Situation report gives us another snapshot of the U.S. labor market, but we should proceed with caution. As I said on Marketplace, a single data point doesn’t tell a story. A collection of data points can start to build clarity. This report adds pieces to that puzzle.
Below are the numbers that stood out to me. As you read them, I want you to think about what feels most telling about the labor market right now. I would love to hear your interpretation of the data in the comments.
The Data That Matters
Jobs & Unemployment
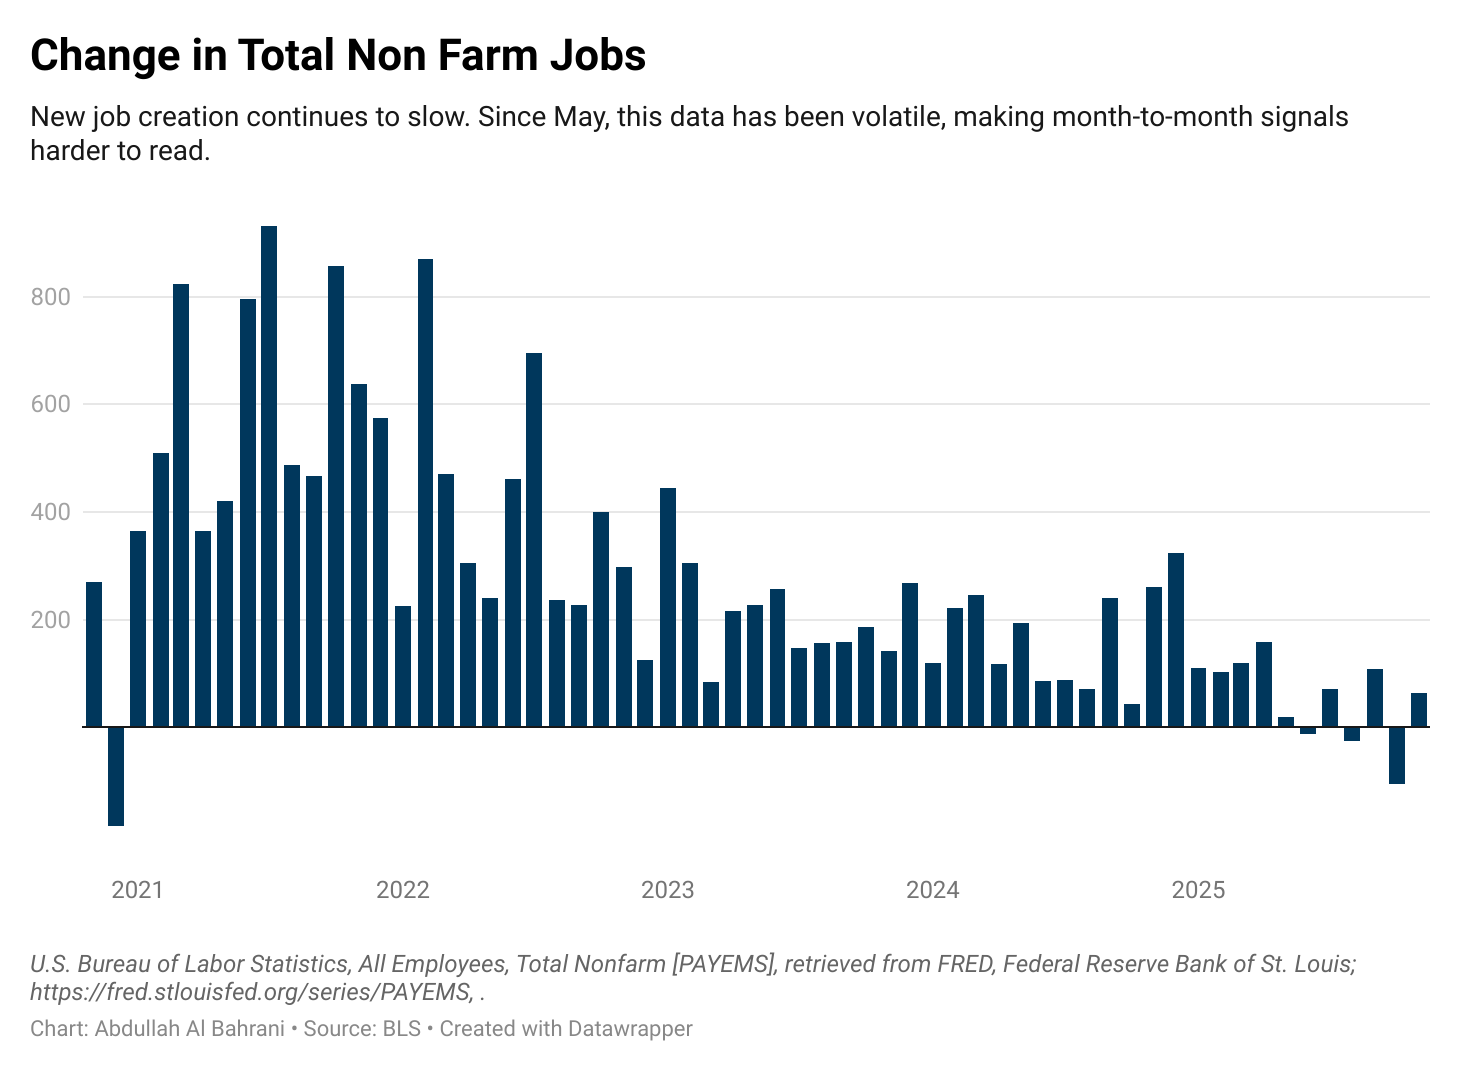
Total nonfarm payroll employment changed little in November (+64,000).
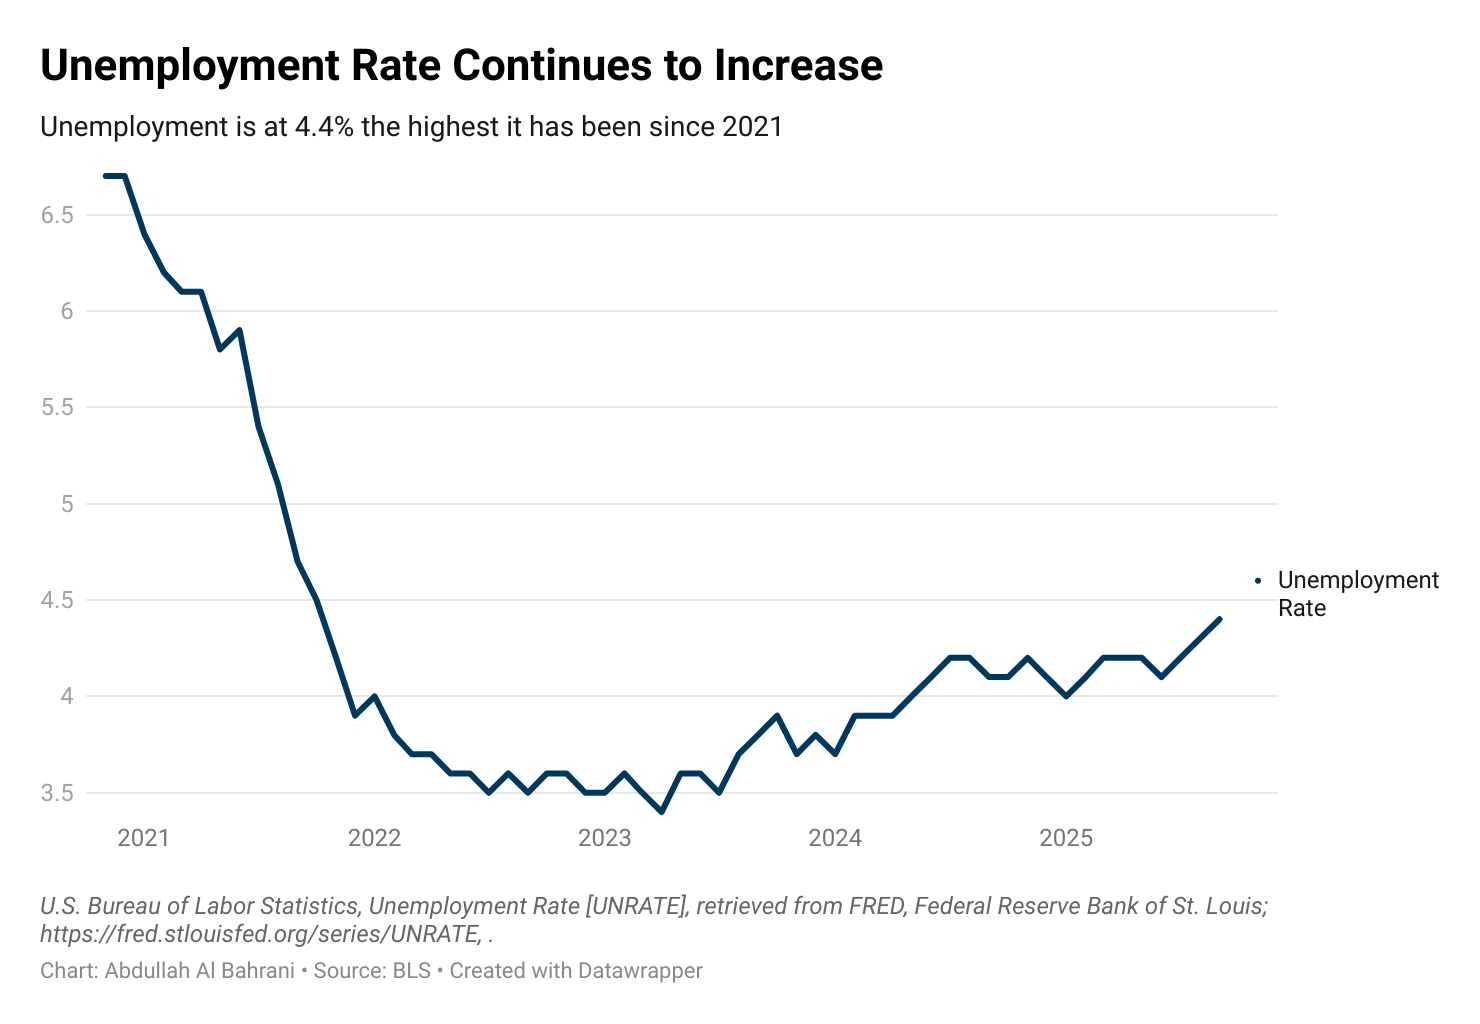
The unemployment rate rose to 4.6%, up from 4.2% a year ago.
The number of unemployed increased from 7.1 million to 7.8 million over the past year.
Who’s Hurting Most
Teen unemployment is 16.3%.
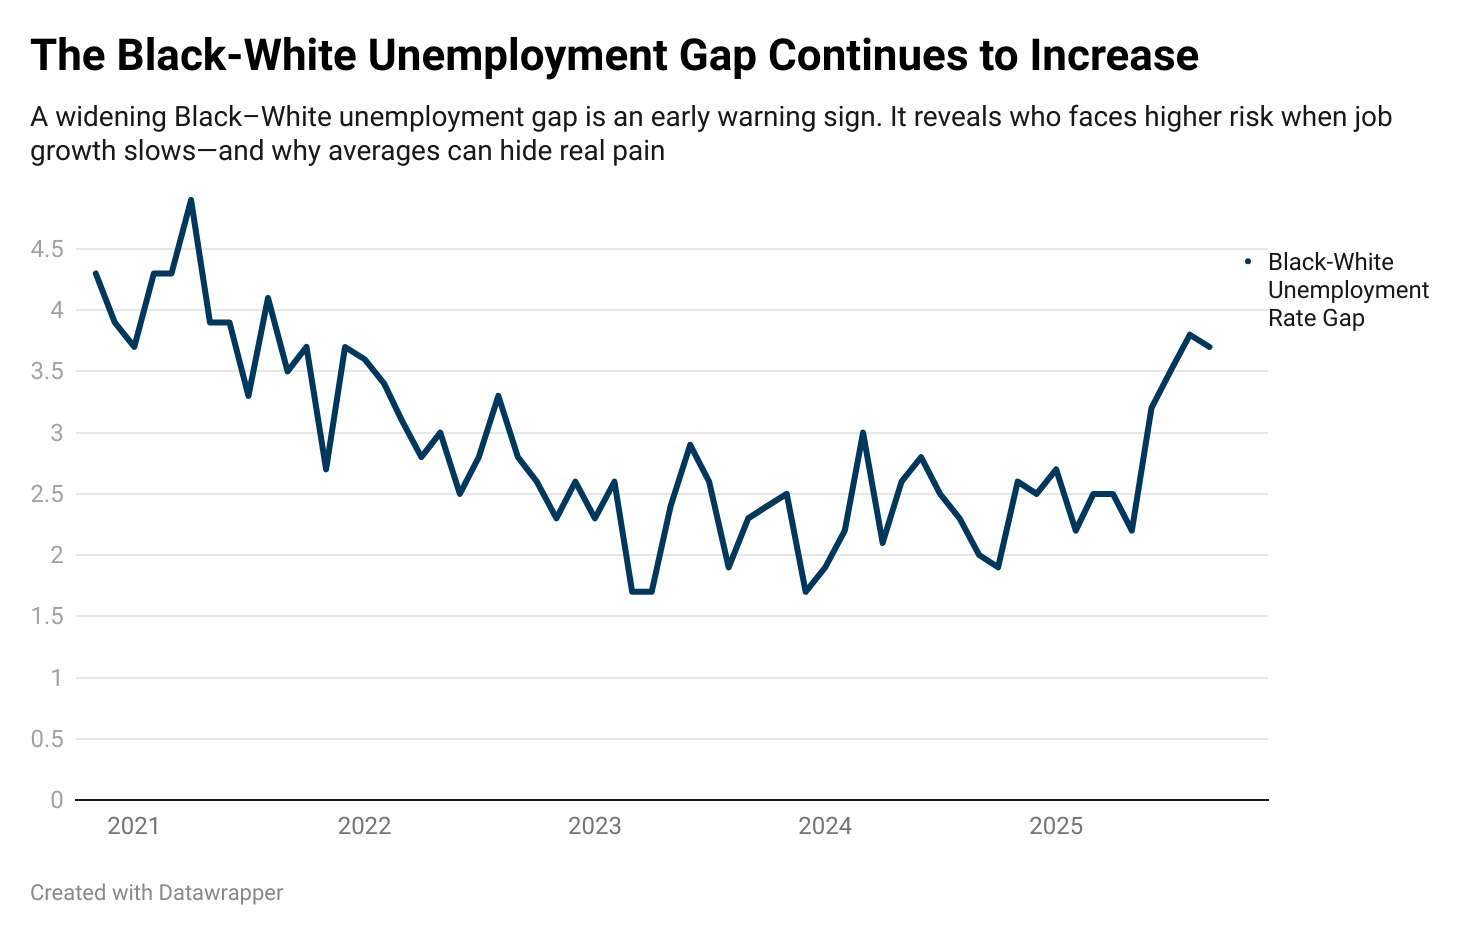
The Black–White unemployment gap remains large at 4.4 percentage points.
Layoffs Are Rising
2.5 million people are unemployed for less than 5 weeks.
That’s an increase of 316,000 in just one month—suggesting recent layoffs are driving unemployment higher.
More People Are Juggling Work
5.5 million people are working part-time for economic reasons.
That’s an increase of 909,000 since September.
The number of people holding multiple jobs rose from 8.7 million to 9.4 million, pushing the share of multiple jobholders from 5.4% to 5.8%.
This is usually a sign that people are trying to make ends meet, not that they suddenly love working two jobs.
Where Jobs Are Being Created
Healthcare: +46,000
Construction: +28,000
Federal government: –6,000, following a 162,000 loss in October
Wages
Average hourly earnings rose 5 cents (0.1%) to $36.86.
Wages are up 3.5% over the past year, continuing to cool.
Let’s Make This Interactive
Here’s where I want to hear from you:
Pick ONE and reply in the comments
Multiple jobholding rising to 5.8%
Layoffs driving unemployment higher
Teen unemployment at 16.3%
Wages still growing, but slowly
The growing gap across demographic groups
Which data point best reflects what you’re seeing—or feeling—in the labor market right now?
And if you want to go deeper:
Does this feel like a cooling labor market?
Are you seeing more people take second jobs in your industry or community?
The Bottom Line
The trend in the labor market data signals a cooling labor market.
Job growth is slowing. Layoffs are picking up. More people are working multiple jobs. Wage growth is easing. The labor market is concerning for younger workers and lower-income households trying to make ends meet.
Your experiences help add context to these numbers. Data builds clarity, but conversation completes it.
What is going on in your labor market?
Some Graphs to Show Trends
For me the multijob numbers are always scary. I think about all the issues that come from this. I think about the kids sitting at home with no parent present because they are working multiple jobs and the impact that has on their education. I think about all the mental health issues and general lack of free-time and how that hurts society as a whole. Employment numbers can be such a cold number because first off, unemployment is not a number it is human beings, and also employment numbers can look great until you realize the multiple jobs aspect and the fact that for some people it takes more than one job to exist.
Thank you, Dr. A., for this data report. It would be helpful to compare these layoffs to those from the same winter period last year, as for some industries seasonal layoffs related to winter conditions are common.